Insights
Clips on what’s happening at the macro level and how Intian helps you respond to it.
July 2026
Where does your team’s time actually go?
Most leaders can’t confidently say where their team’s time and effort goes, or whether it connects to strategy. A short introduction to what Intian does and why that question matters.
Under the bonnet
Walkthroughs of the analysis and the output. Click through each one.
01 / 04
Org Health Score
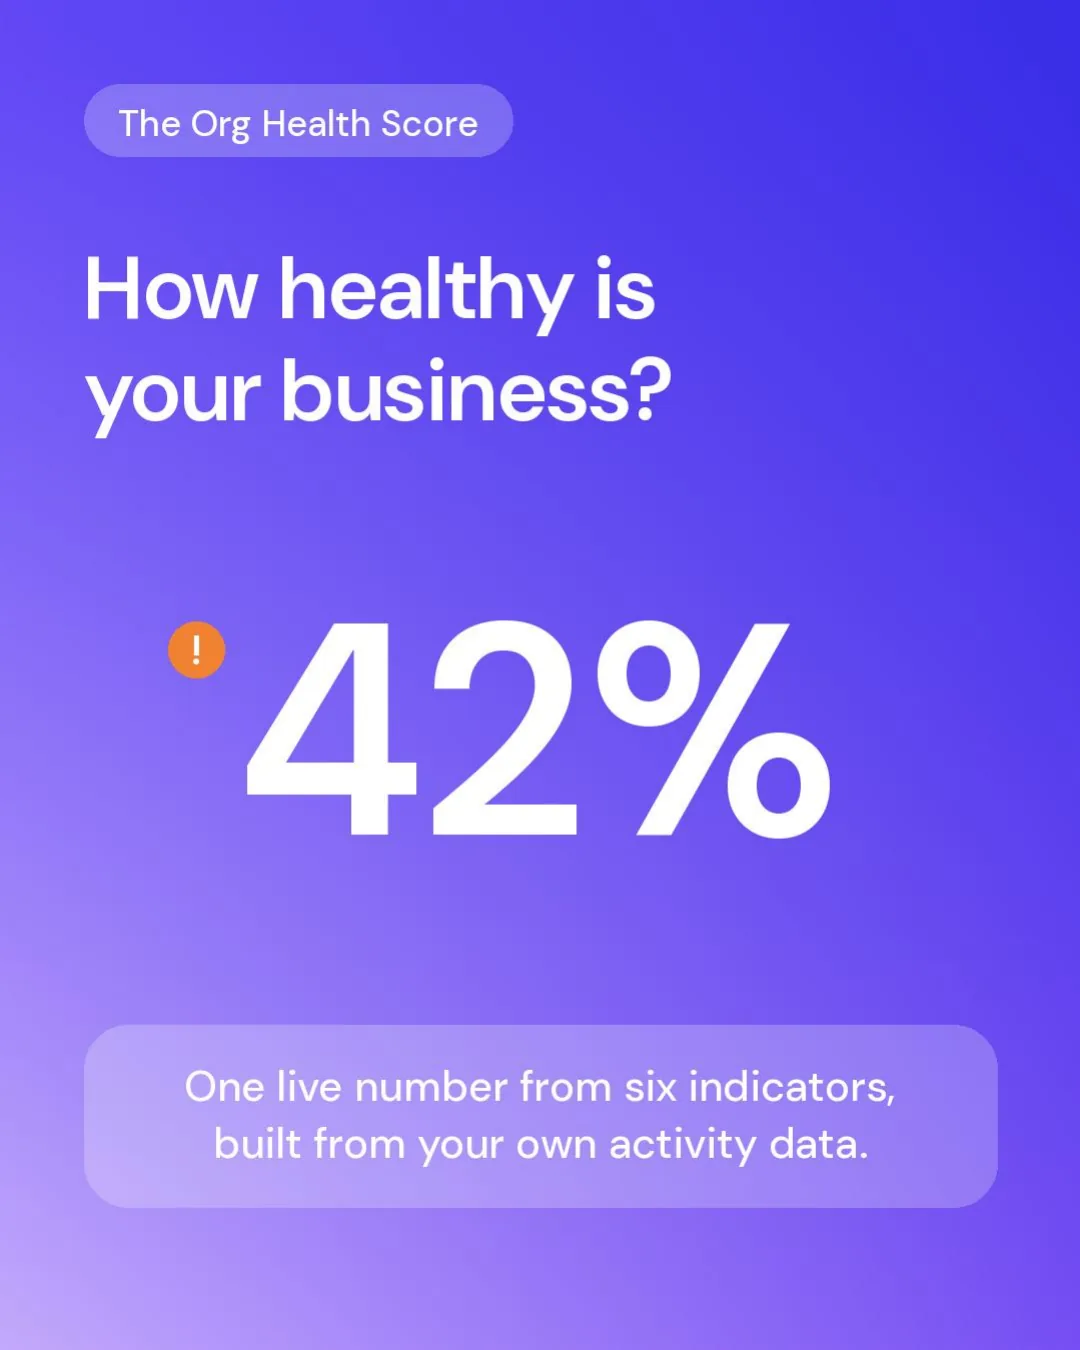
How healthy is your business, right now?
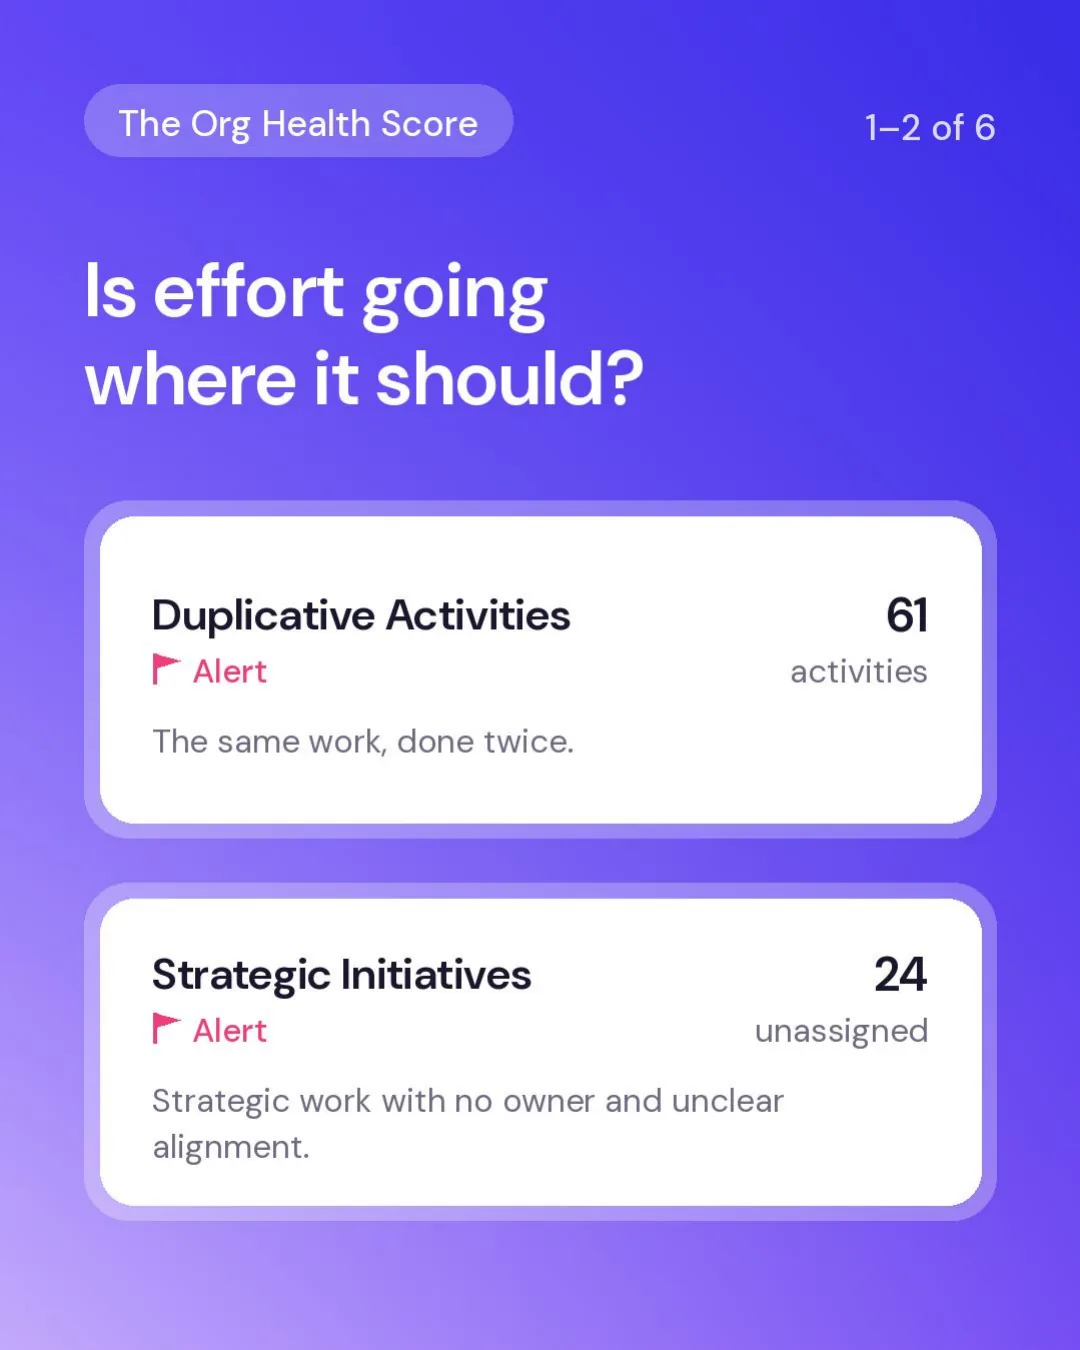
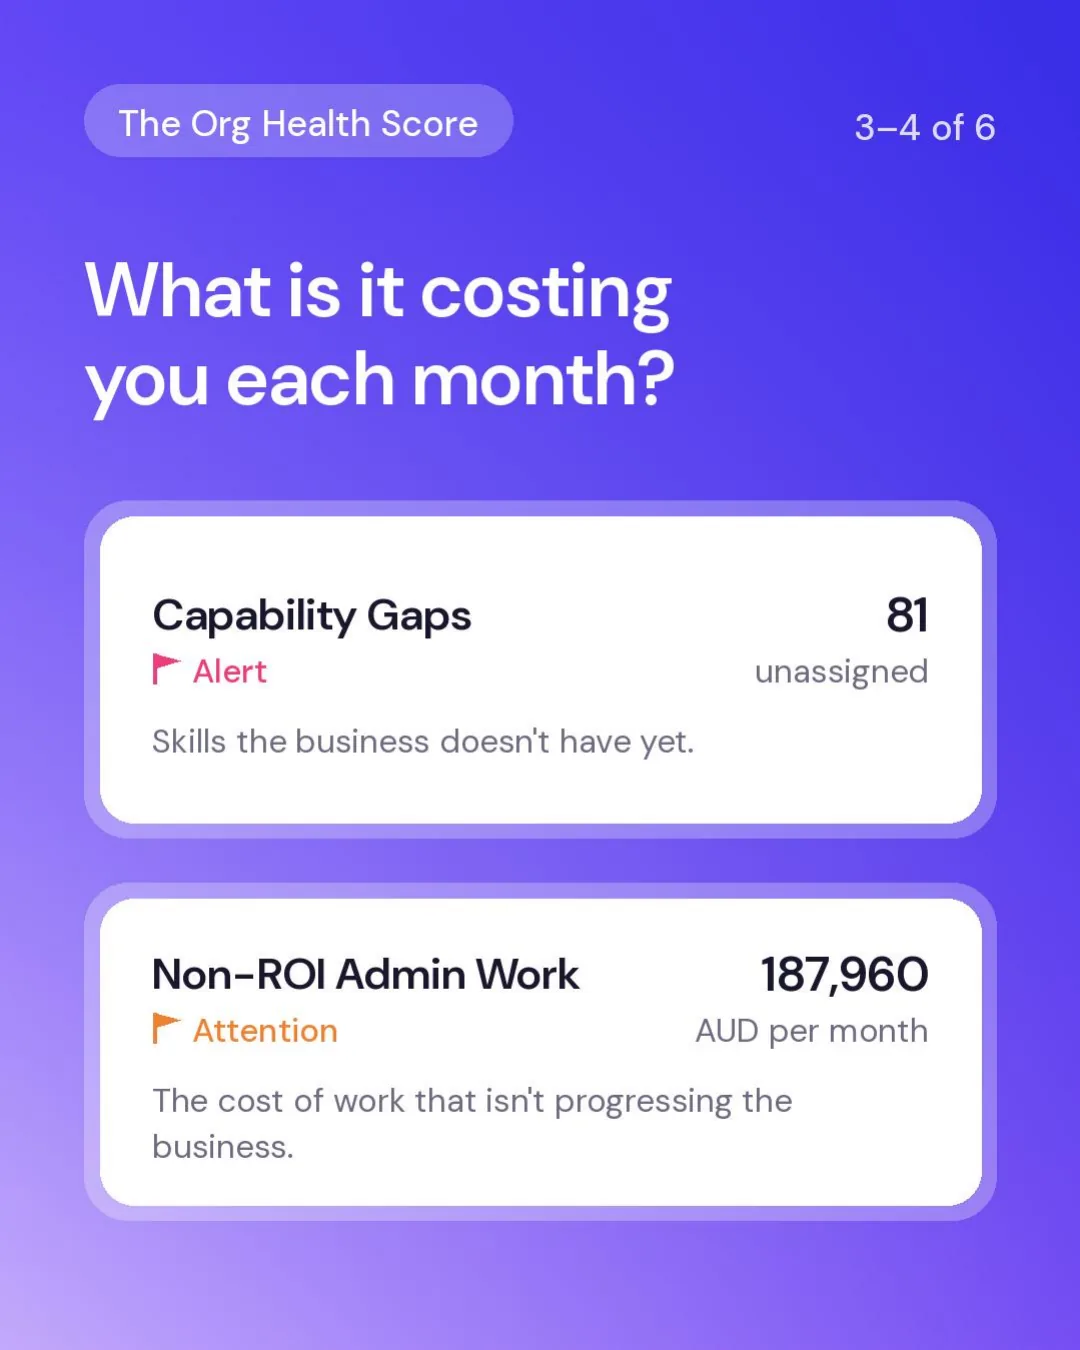
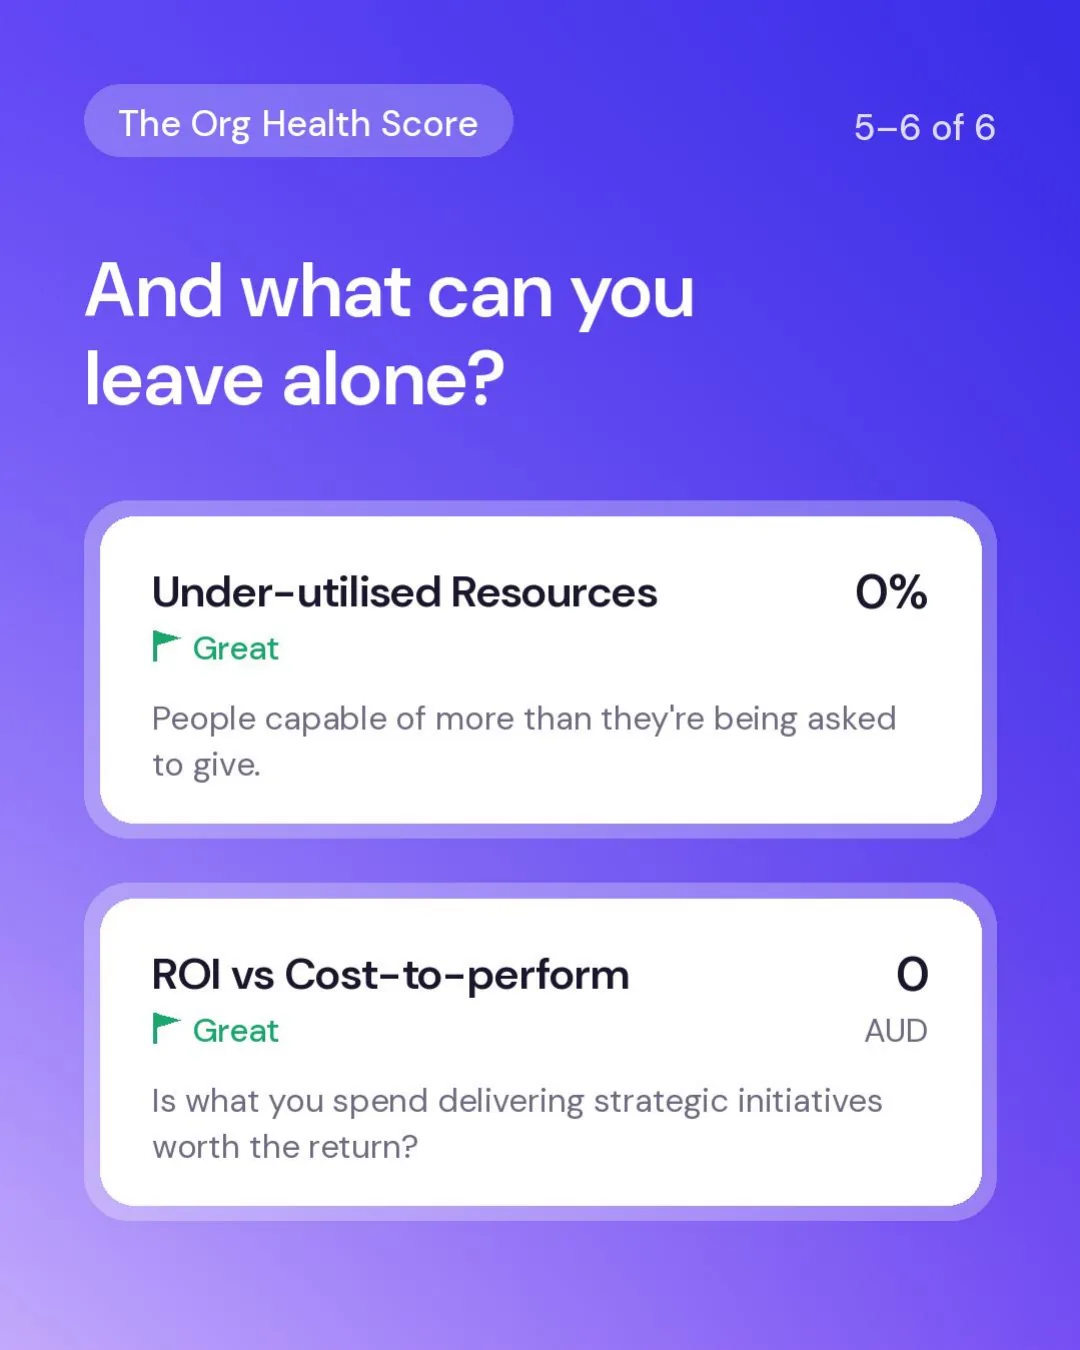
Most SMEs can answer that with a feeling. The Org Health Score answers it with a number, built from six indicators across your activity, capability and strategy. It moves as your business moves, so you catch the drift the week it starts and not the quarter after.
Each indicator is scored on its own, so the number always tells you where to look first.
01 / 06
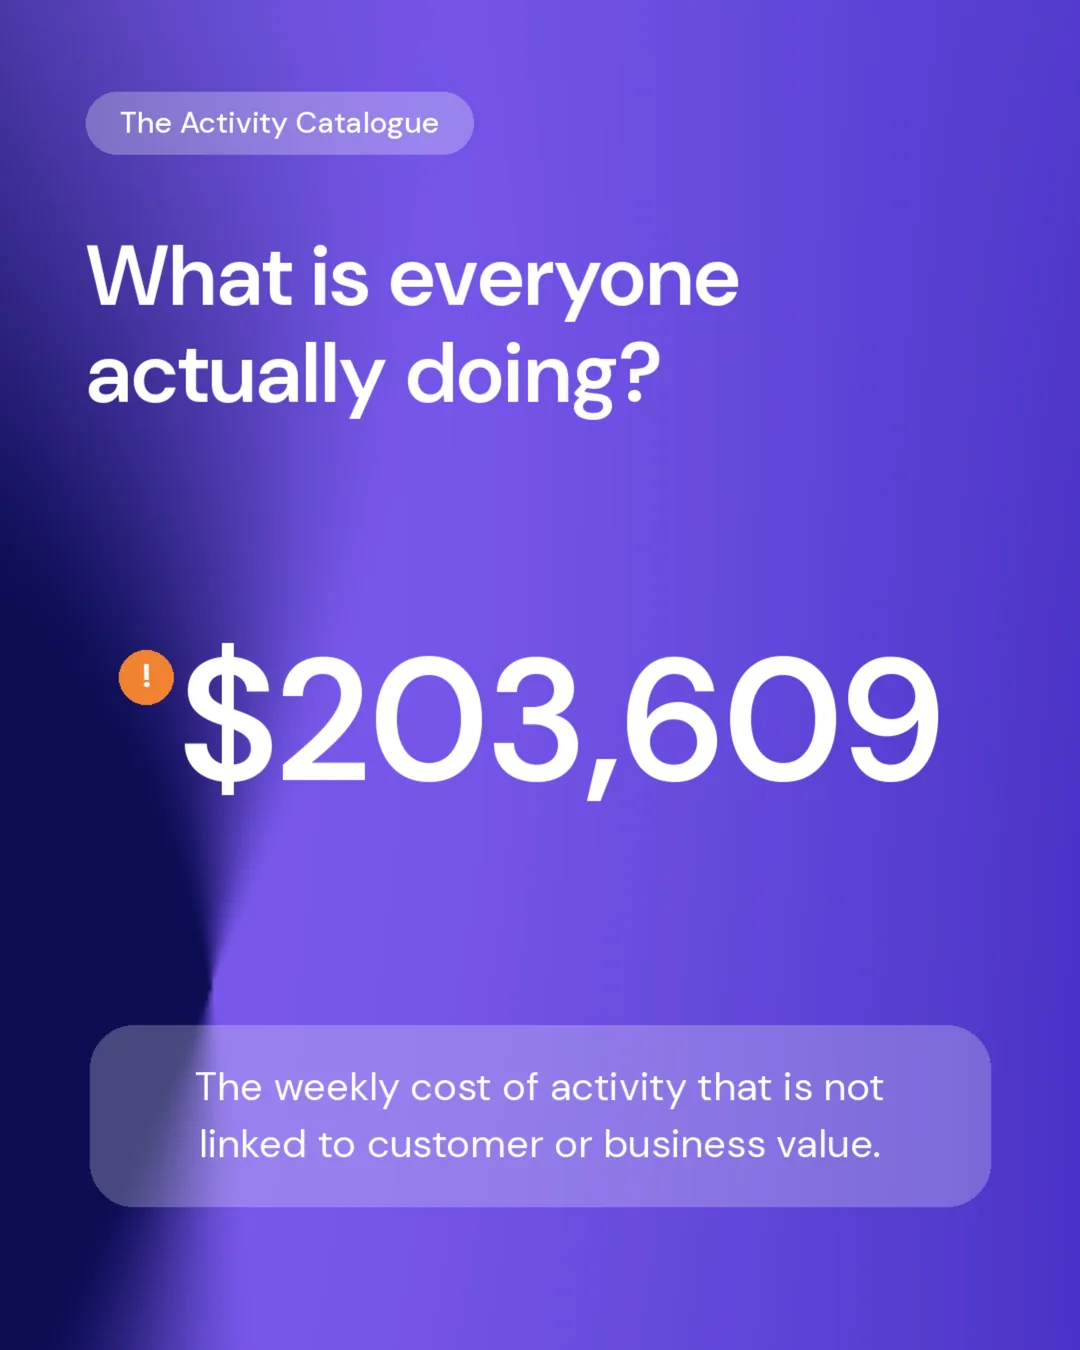
Activity Catalogue
Strategy, cost and service delivery all come back to what people actually do day-to-day. When ballpark ‘tasks’ are assigned or assumed, that link can be unclear.
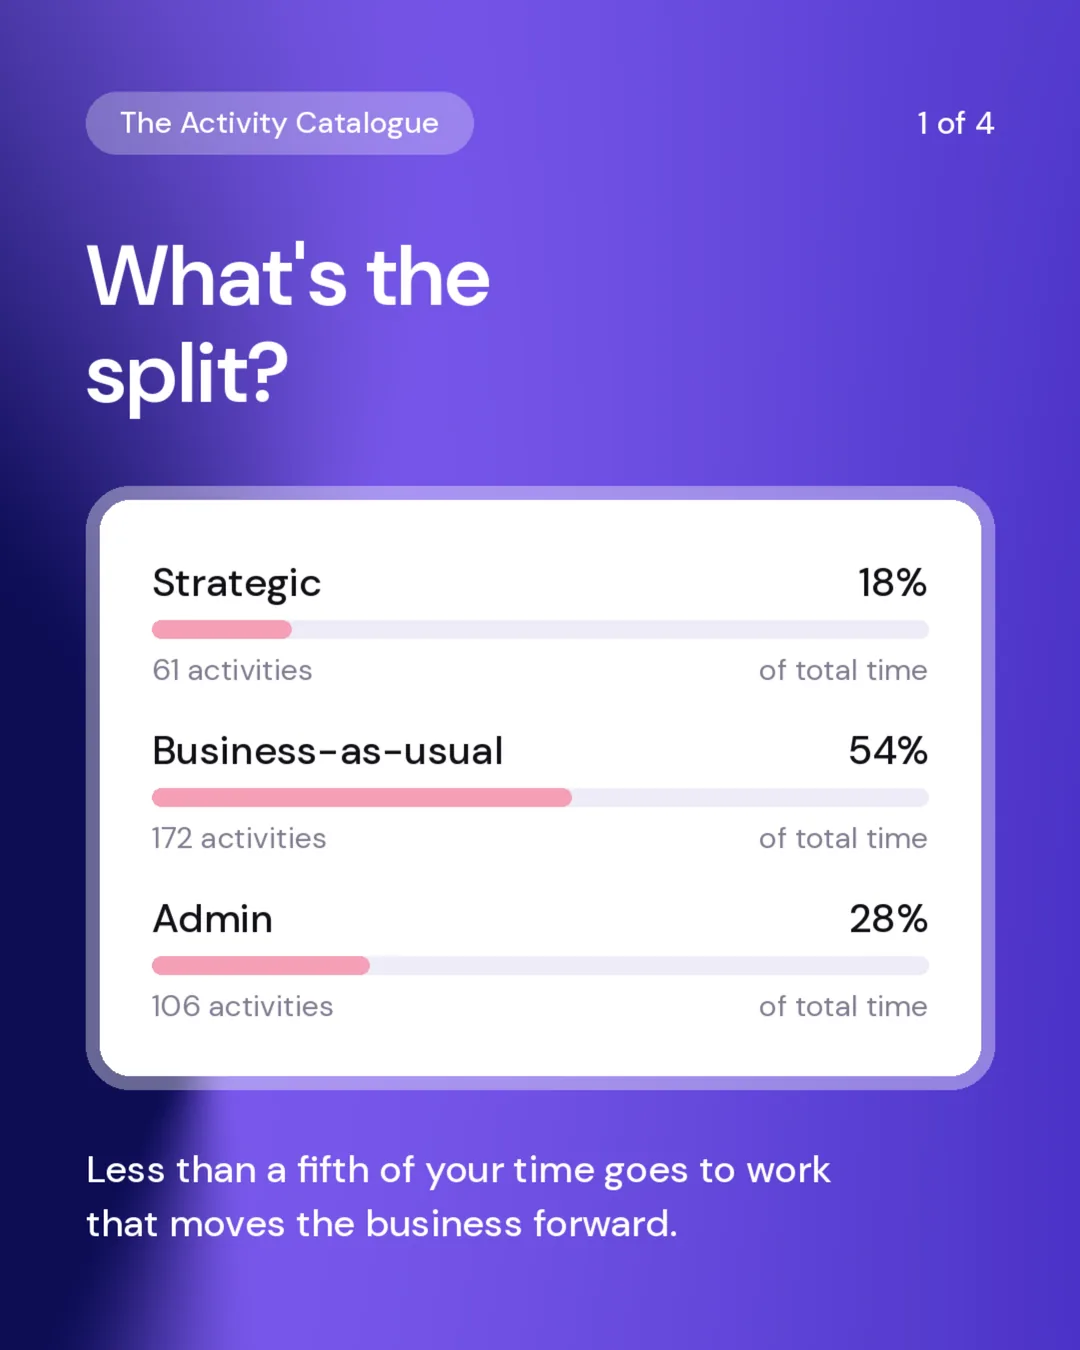
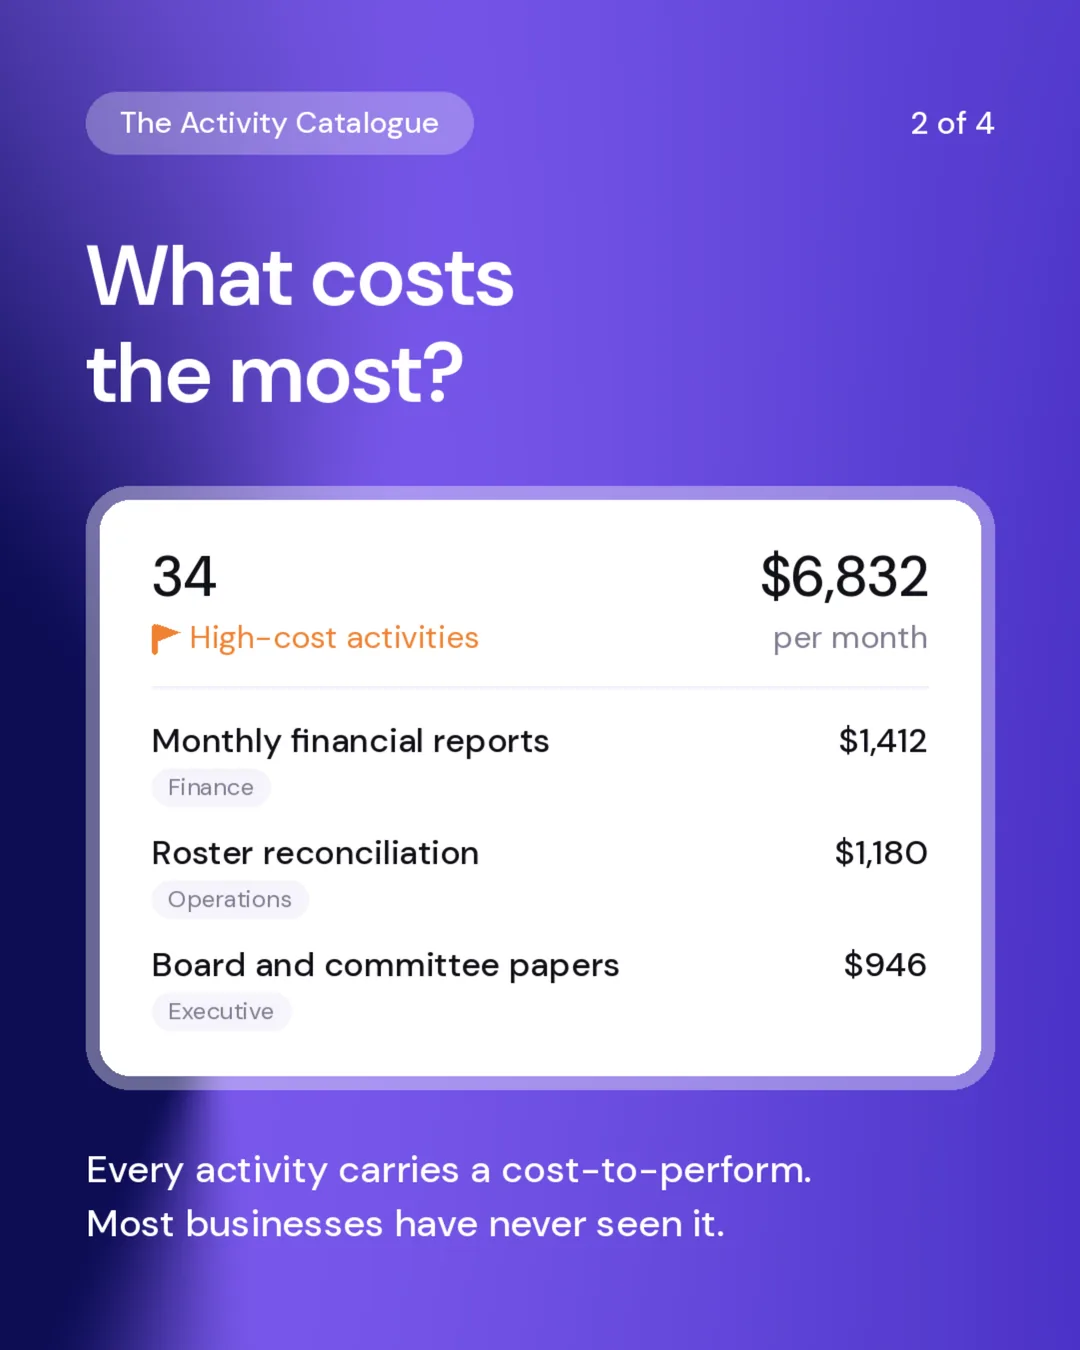
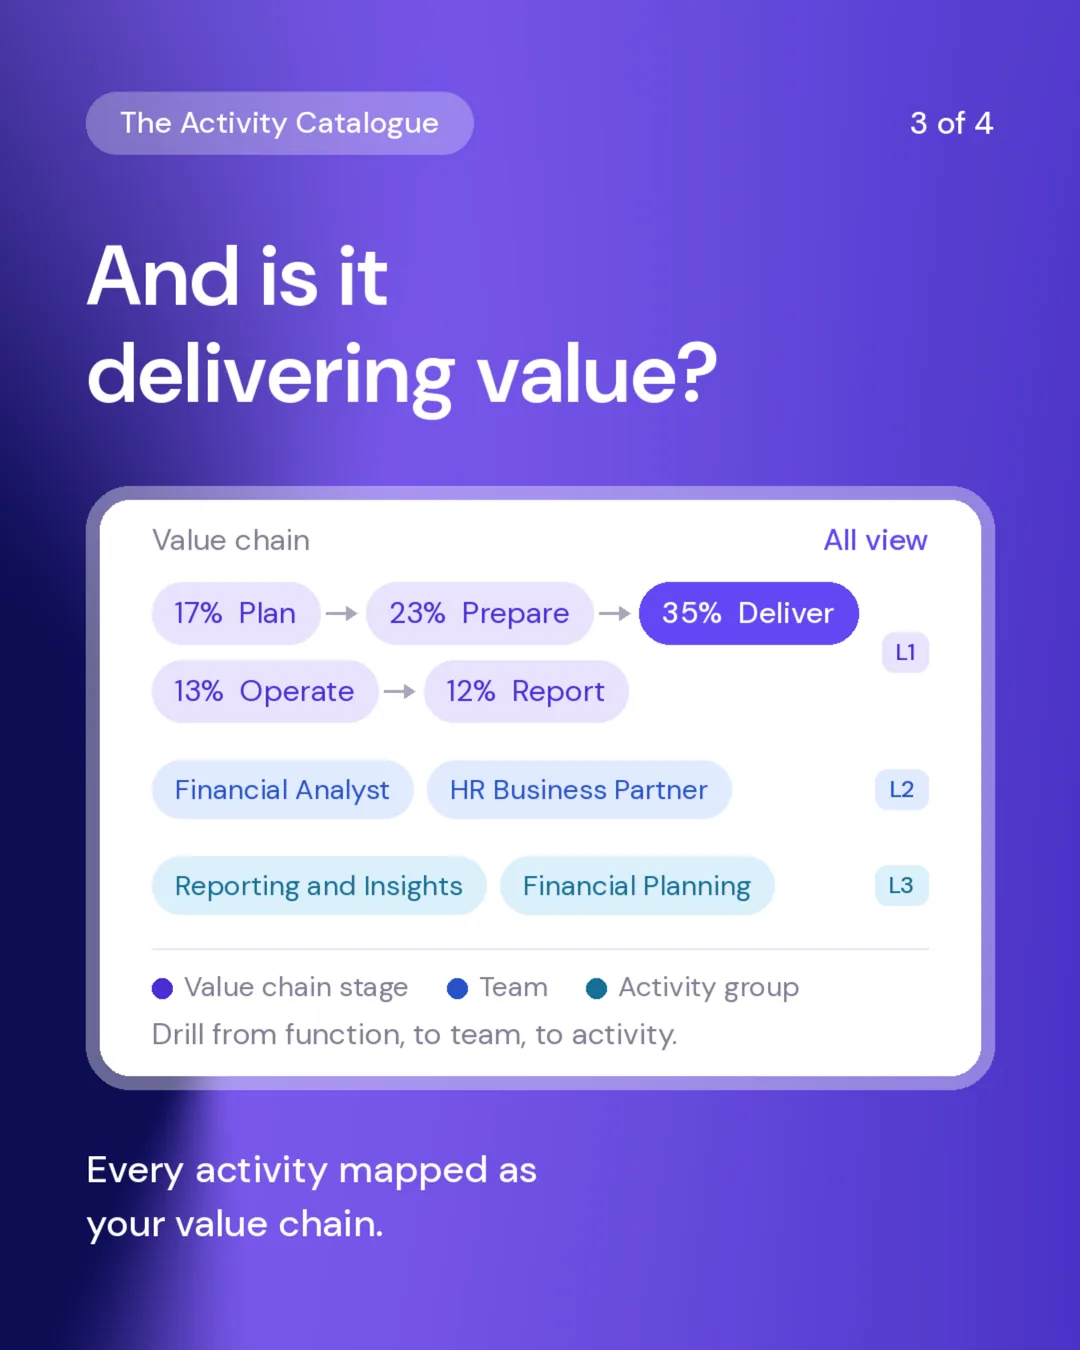
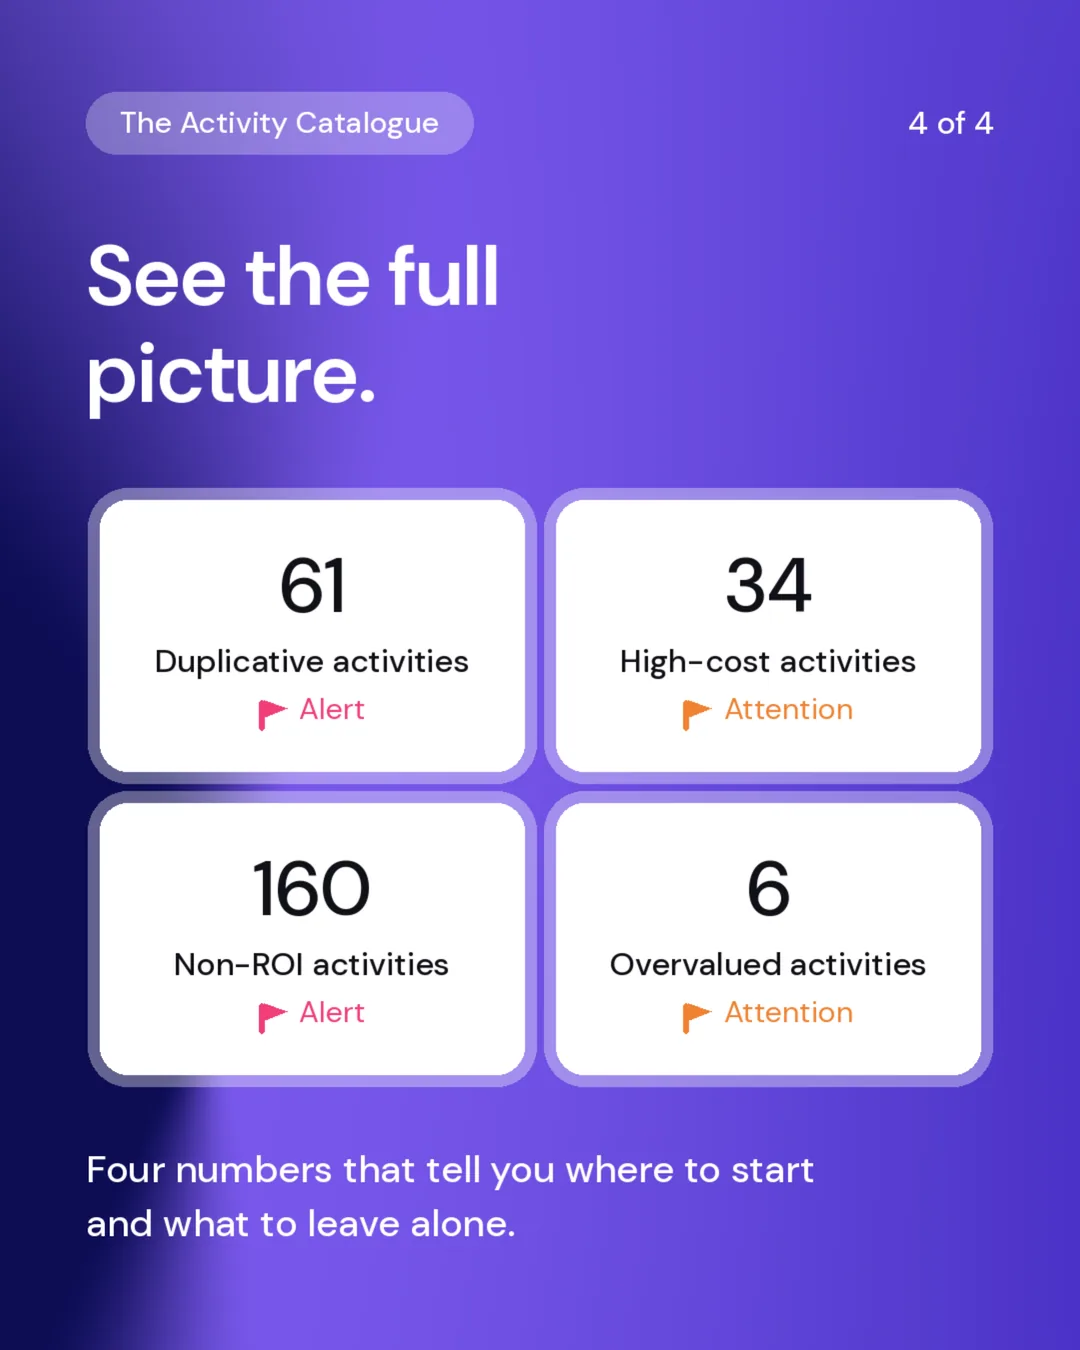
The Activity Catalogue maps every activity, puts a cost against each one and links it back to the value chain, showing both cracks and opportunities.
With that in front of you, reducing cost waste, cutting duplicated work and redesigning services all get a lot easier.
01 / 06
Strategic Initiatives
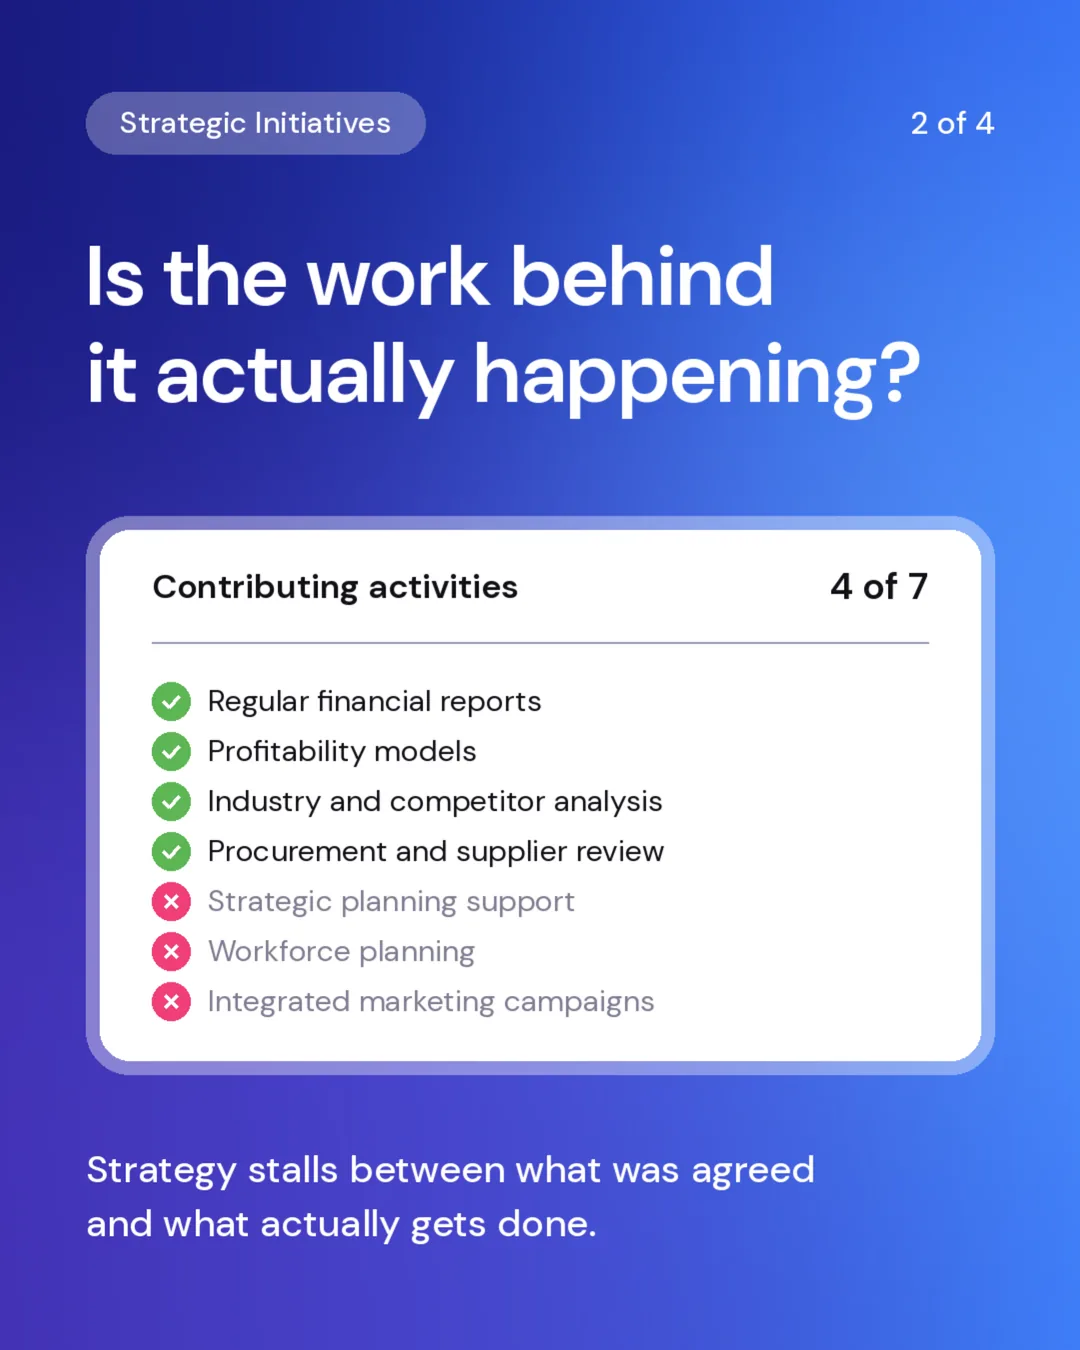
Plenty of systems will hold your strategy or track your goals, though most only see the work someone remembered to put in them.
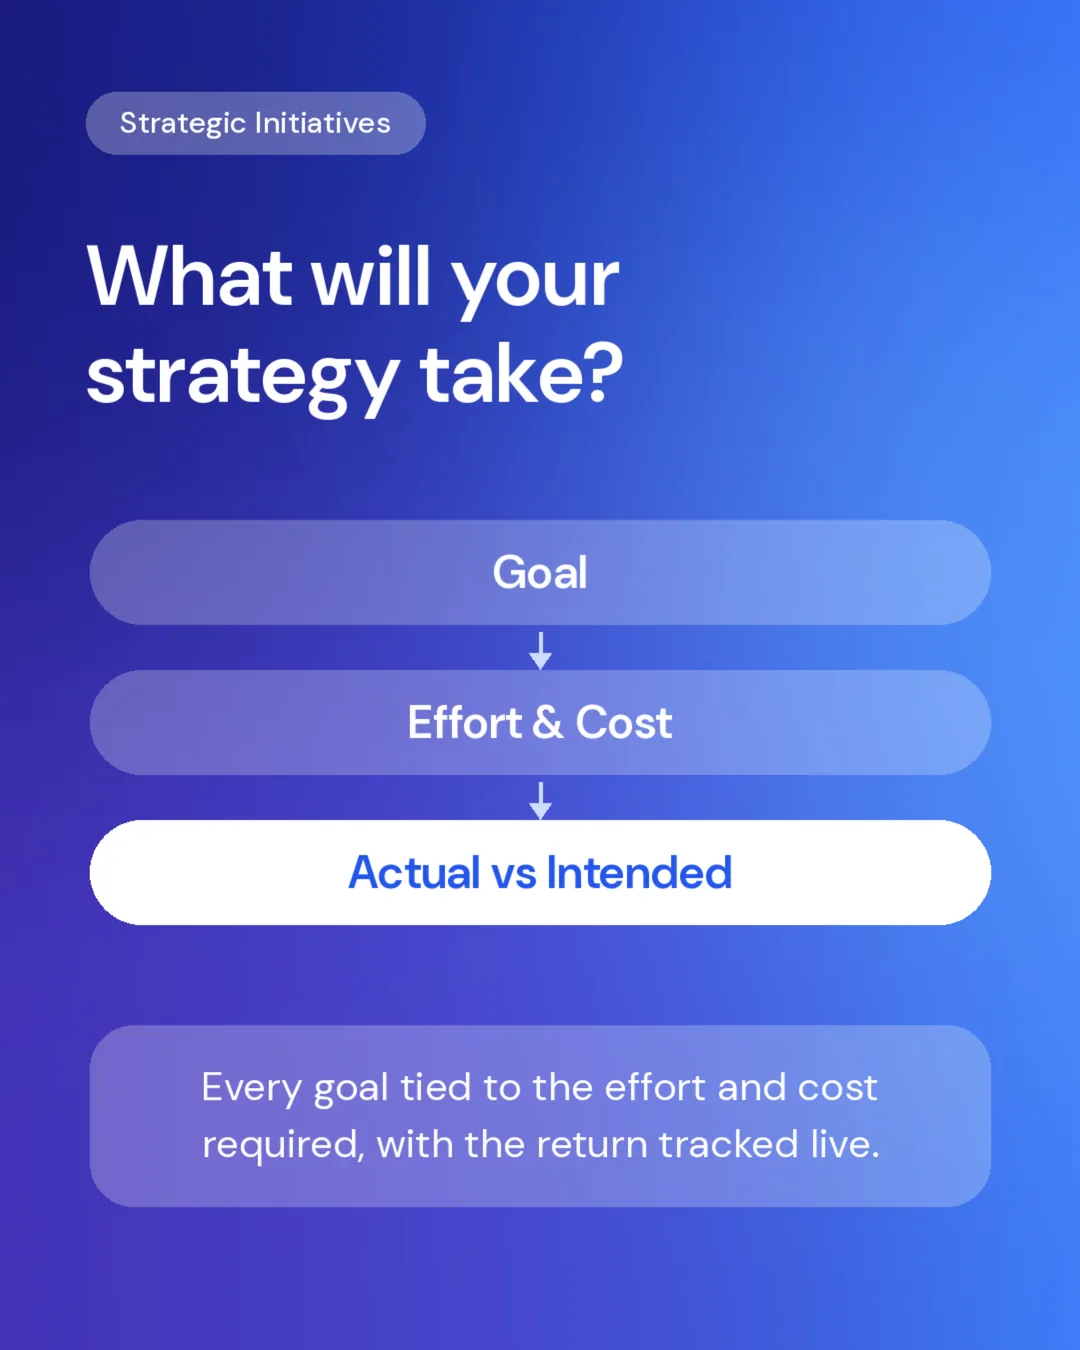
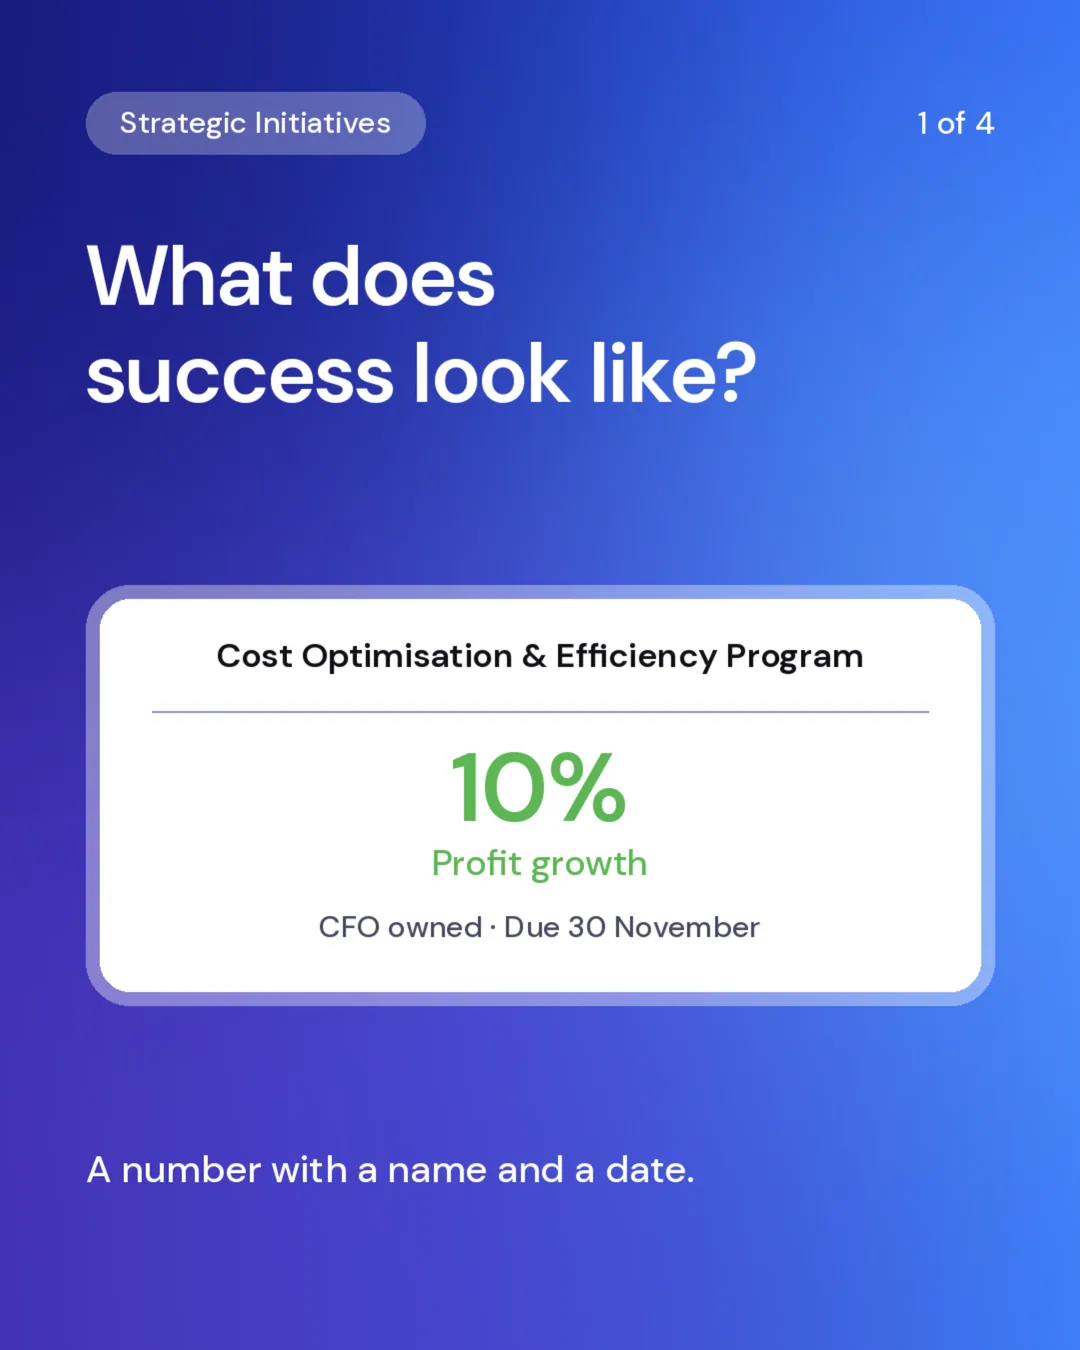
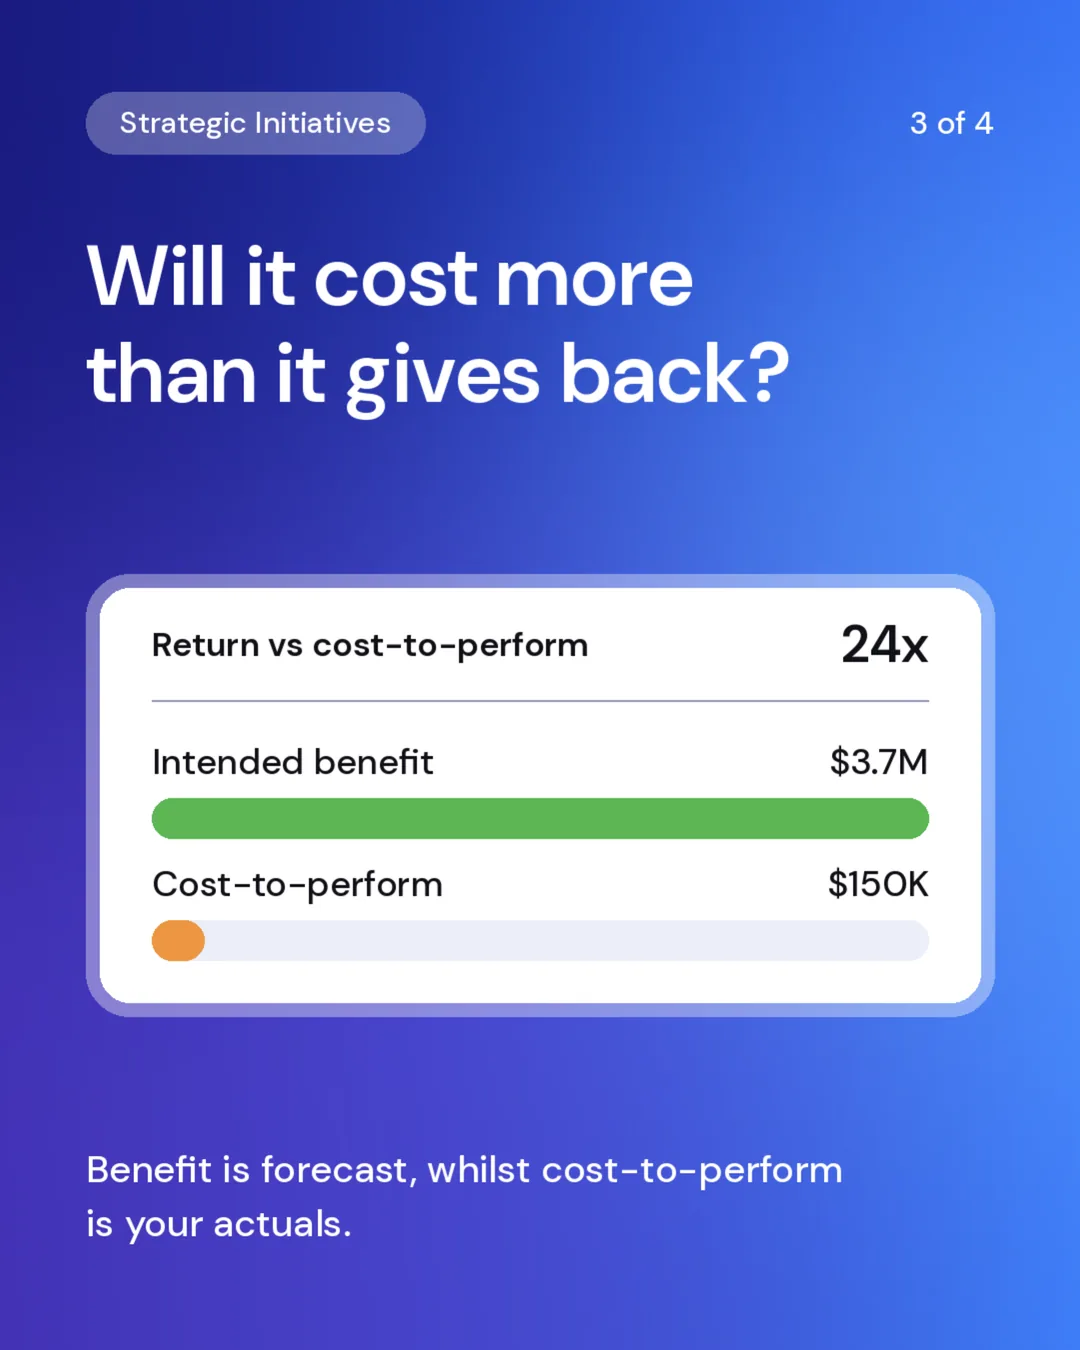
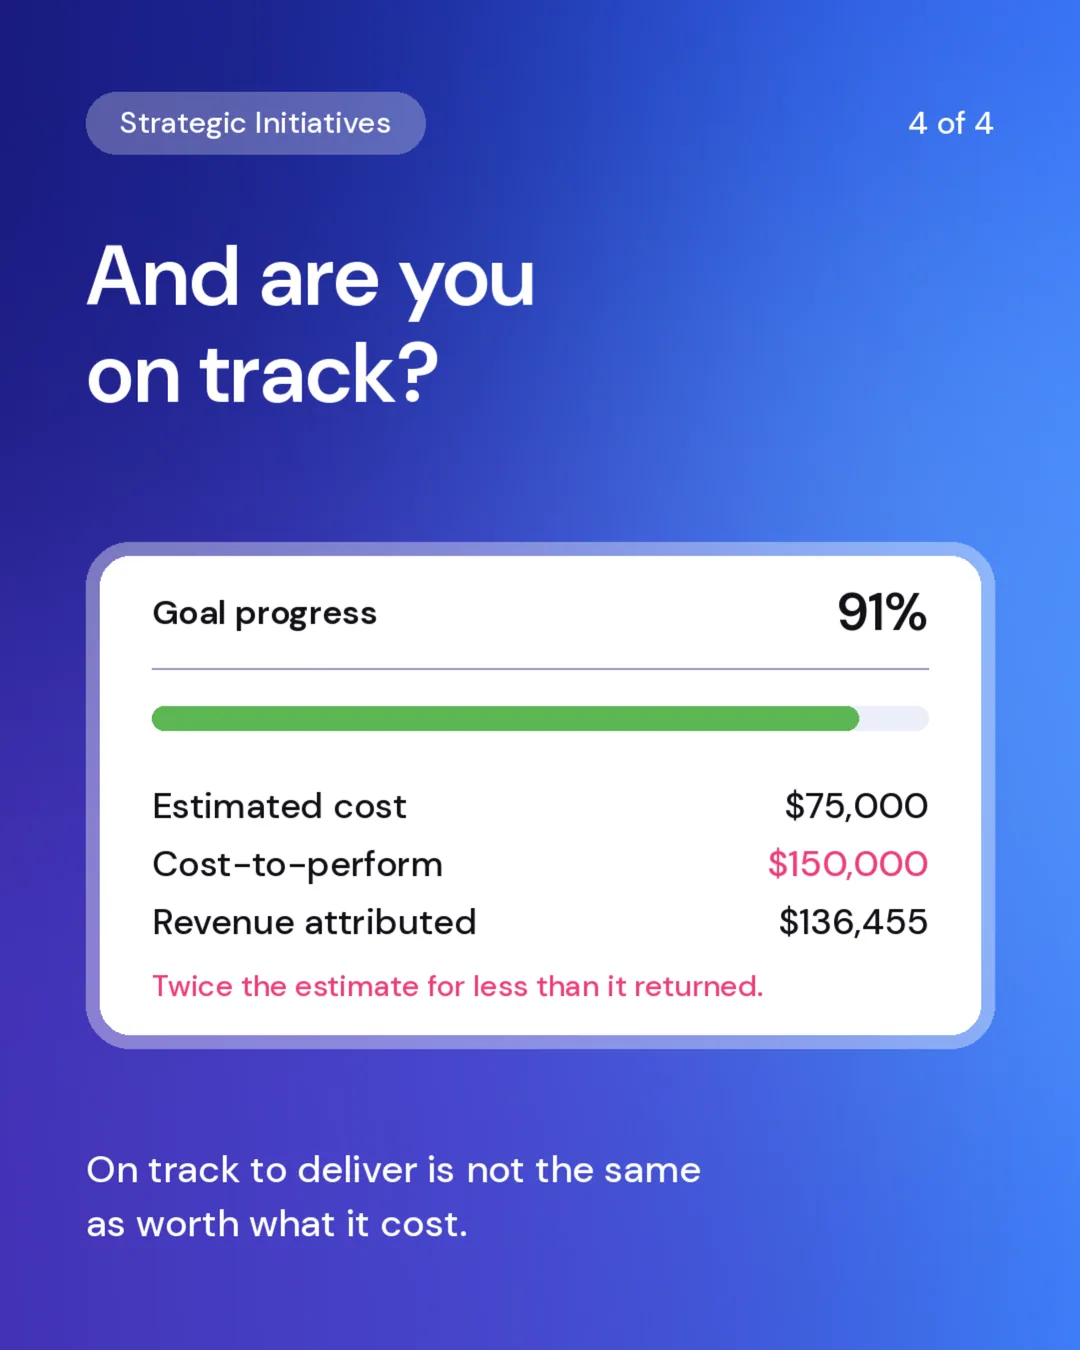
Strategic Initiatives puts actual against intended, tying each goal to the activities delivering it and the cost to perform behind them, while surfacing the strategic work sitting in isolation. If an activity can’t be mapped back to an initiative then it’s worth asking why anyone is still doing it.
With that in front of you, prioritising initiatives, justifying the spend and stopping the work that isn’t tied to anything all get a lot easier.
01 / 04
Capability Catalogue
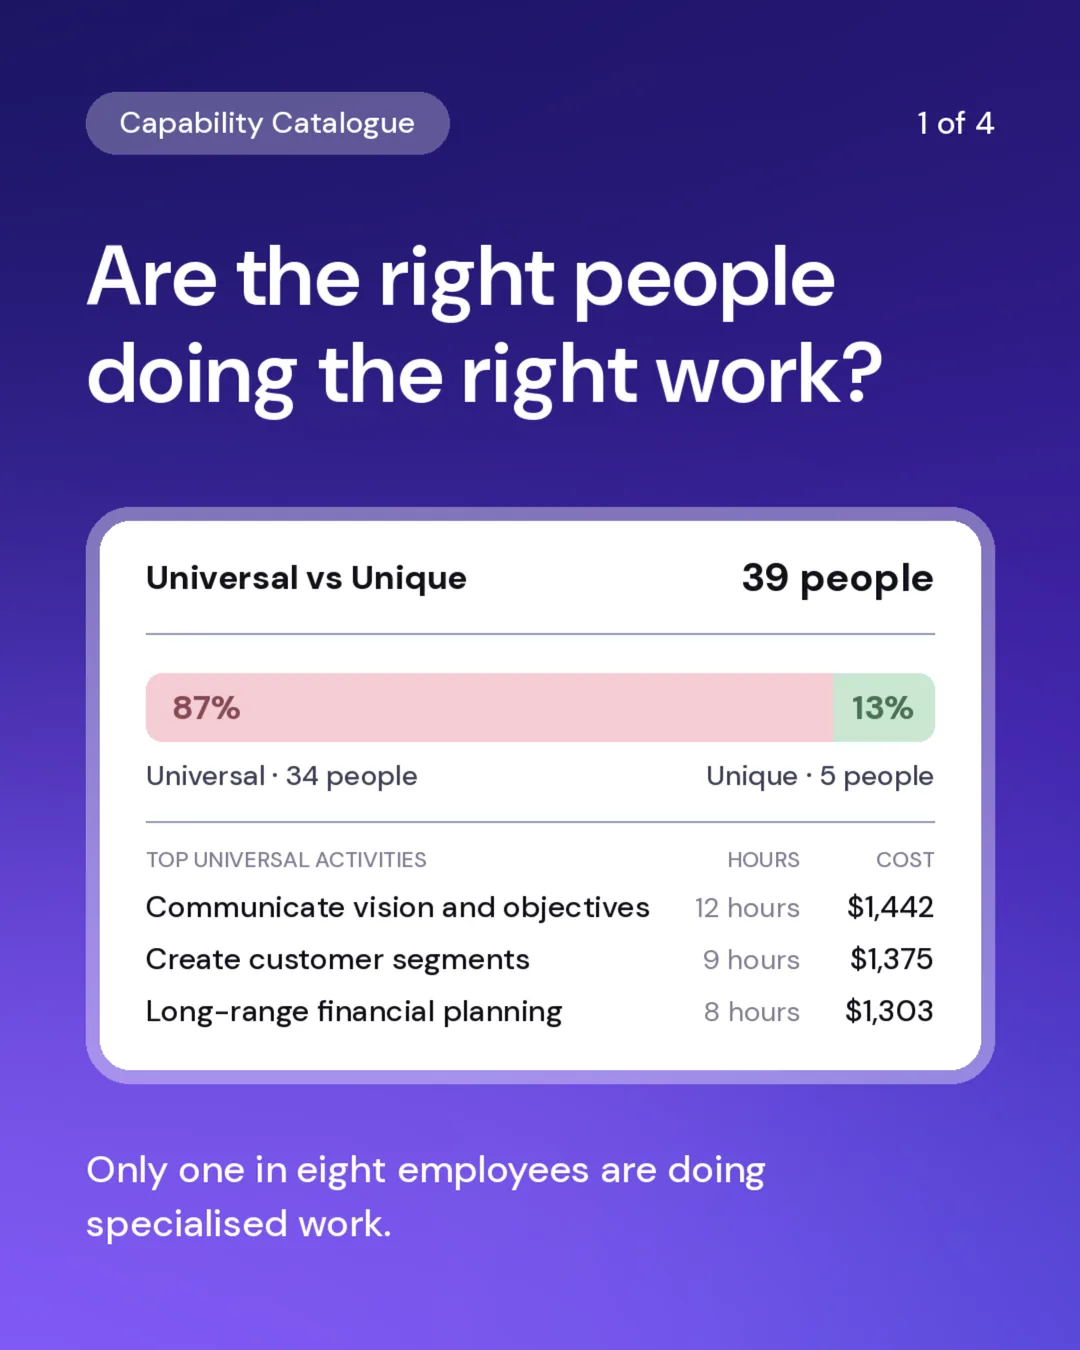
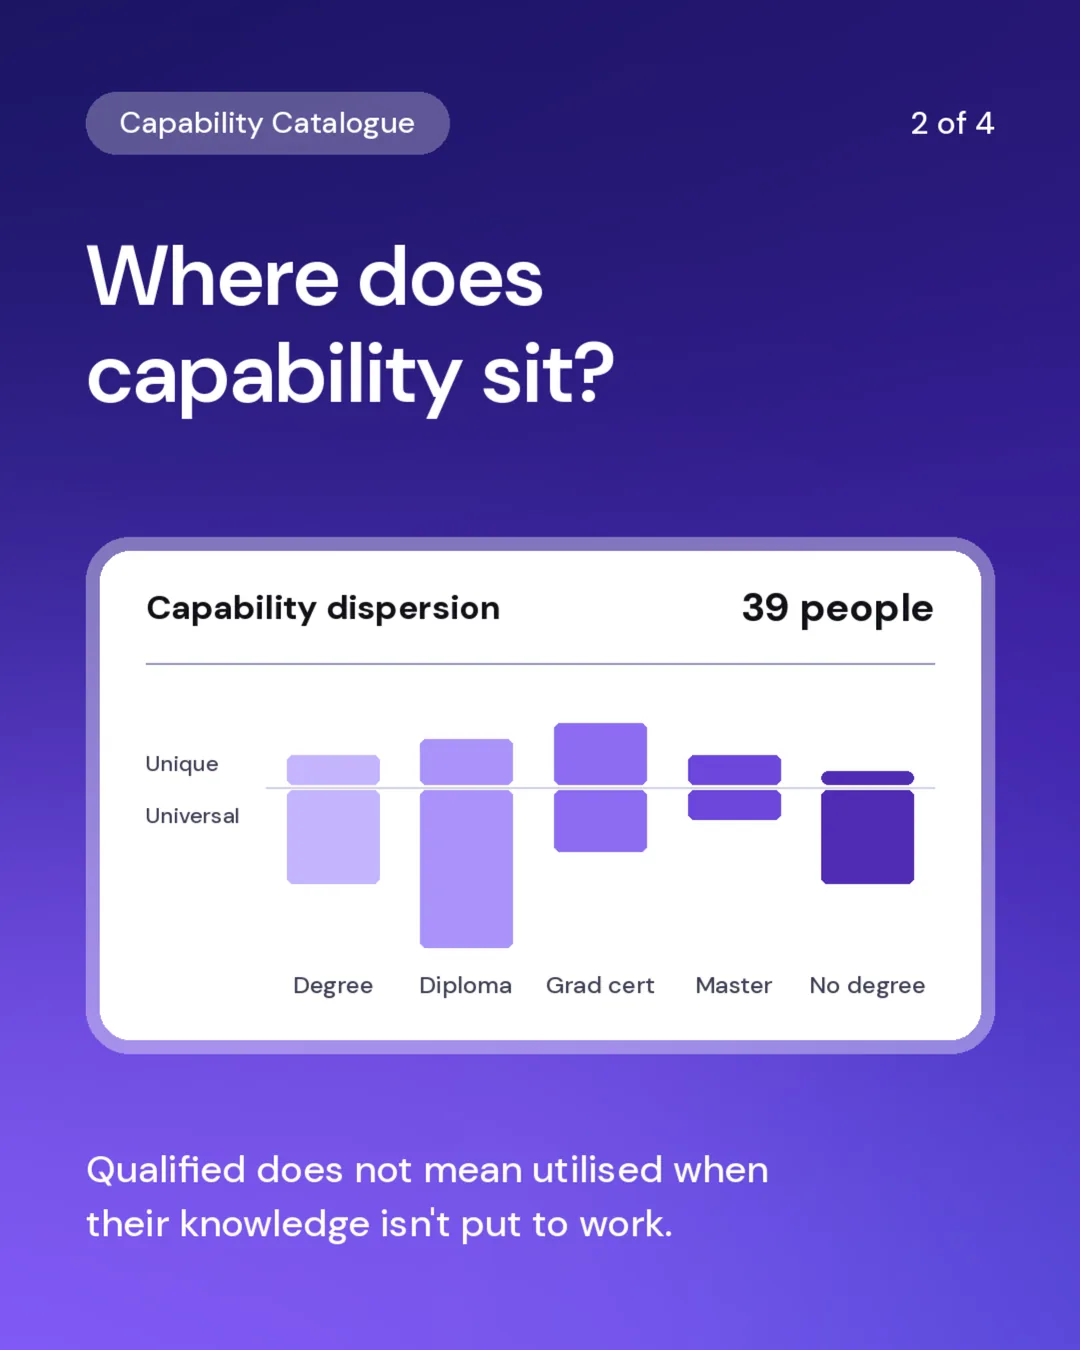
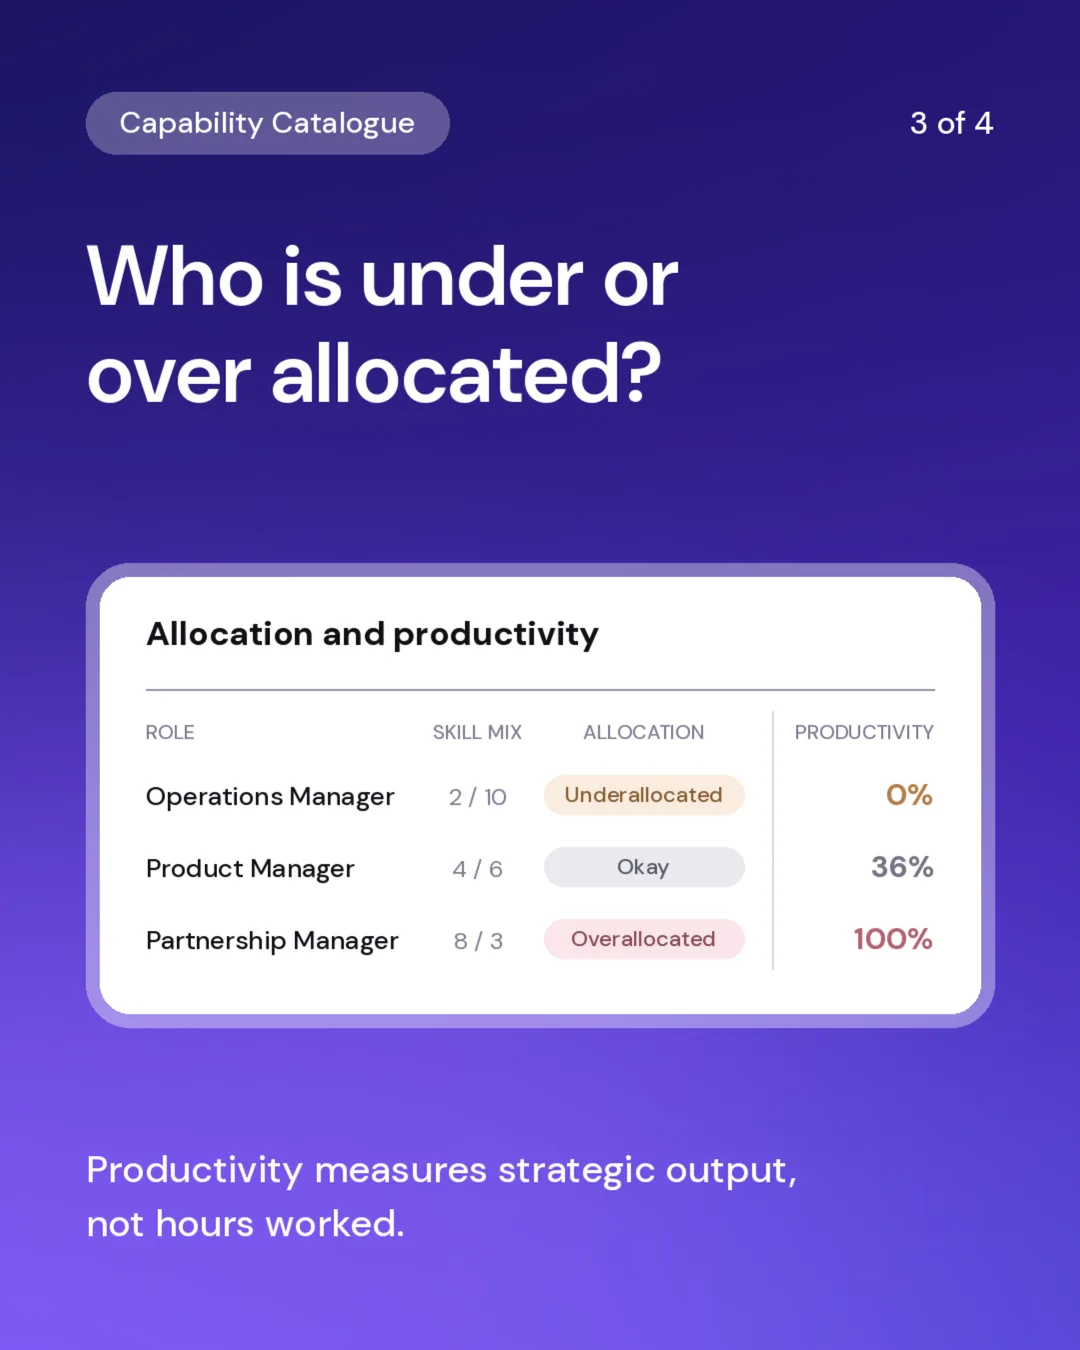
The Activity Catalogue shows what work exists and what it costs. Strategic Initiatives tie that work to the goals it is meant to deliver. The Capability Catalogue answers the third question, which is whether the right people are doing it.
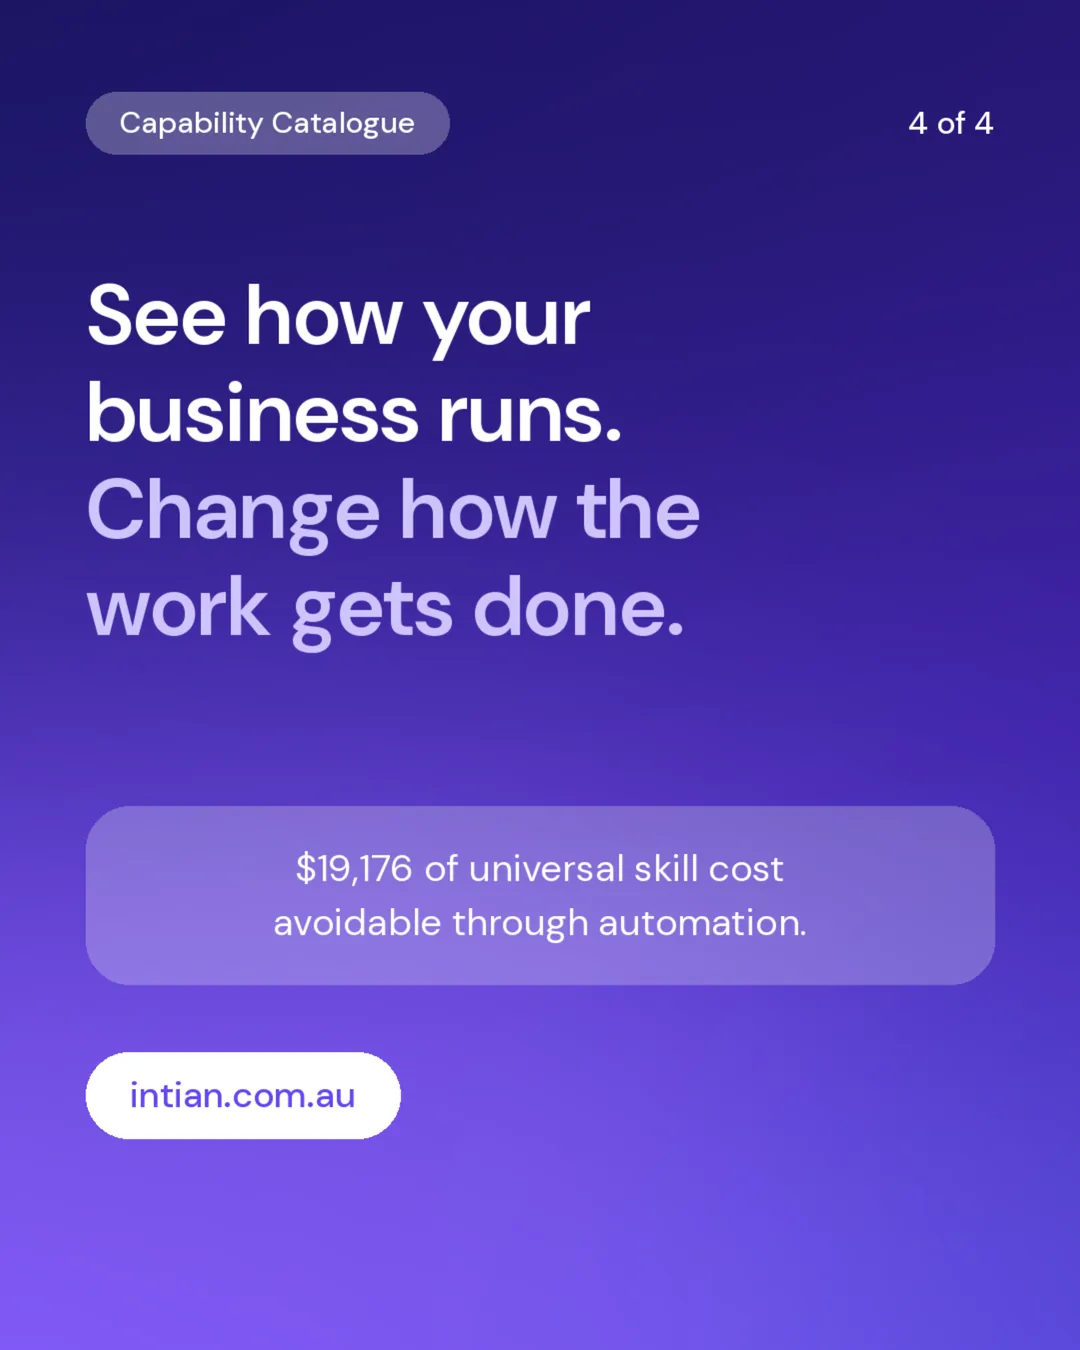
Universal activities are the standardised work that almost anyone could pick up, and are usually the first candidates for automation or a lower-cost role. Unique activities are the specialised work that genuinely needs the person doing it. When most of your workforce sits on the universal side, you are paying specialist rates for work that does not need a specialist.
With that in front of you, workforce planning, role design and deciding what to automate all get a lot easier.